Delhi’s Diwali Pollution Data Raises Questions Over AQI Reporting

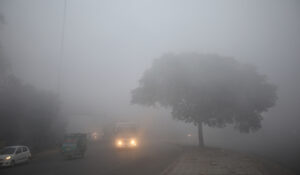
The central issue here is not simply which AQI figure should be believed. It is whether Delhi’s monitoring system is providing a complete and reliable picture of the air people in the national capital breathe (Image: PTI)
Was Delhi’s air quality index (AQI) 373 or 1,747 on Diwali? The wide gap between the figures has brought the capital’s pollution monitoring system under scrutiny. While the Central Pollution Control Board (CPCB) reported an AQI of 373, other platforms showed readings as high as 1,747. Meanwhile, Delhi Pollution Control Committee (DPCC) data revealed hourly PM2.5 concentrations reaching nearly 5,000 micrograms per cubic metre (µg/m³) at one monitoring station.
The differences have raised concerns about how pollution is measured, how monitoring data is processed and why some readings were missing or later changed.
At Jahangirpuri, hourly PM2.5 concentrations reportedly reached 4,985 µg/m³ at 6 p.m. and 8 p.m. on Diwali. However, the DPCC data was subsequently revised, showing a peak of 776 µg/m³ at midnight. The substantial change has prompted questions about how the original readings were handled and why they were altered.
Other monitoring stations also recorded extremely high pollution levels. Mundka registered 3,744 µg/m³ at 2 a.m. on November 9, after recording 245 µg/m³ at 7 p.m. the previous evening. JNU recorded 3,023 µg/m³ at 4 a.m., while NSUT West Campus and Mandir Marg reported 3,008 µg/m³ and 2,908 µg/m³, respectively.
Several other locations, including Nehru Nagar, Wazirpur, Talkatora Garden, Patparganj and Ashok Vihar, also recorded hourly PM2.5 levels above 2,500 µg/m³.
The concern is not limited to unusually high readings. A large number of observations were also missing from the official monitoring records during the period of severe pollution.
Missing readings and changing data
On Monday evening, the DPCC released 125 hourly observations that had not appeared in the CPCB’s records. All reportedly showed PM2.5 concentrations above 1,000 µg/m³. Eleven monitoring stations had recorded levels exceeding 2,000 µg/m³.
The disruption affected a substantial part of Delhi’s monitoring network. Of the capital’s 59 stations, 36 stopped reporting readings overnight between Sunday and Monday. The number of stations not reporting increased from one at 7 p.m. on Sunday to 36 by 1 a.m. Monday. The Centre for Research on Energy and Clean Air (CREA) identified 227 missing hourly observations between midnight and 5 a.m.
The DPCC attributed at least some of the interruptions to technical limitations in monitoring equipment. Its member Anil Gupta told NDTV that stations stopped providing readings when pollution crossed 999 µg/m³, describing the problem as a “technical glitch”.
The DPCC’s 2019 technical specifications reportedly set the measuring range of continuous particulate matter analysers at 0–1,000 µg/m³. However, this does not explain every interruption. At RK Puram, for example, the last available reading was 924 µg/m³.
It is therefore necessary to establish whether the missing data resulted from equipment limitations, transmission failures or the procedures used to validate readings. The agencies also need to explain how delayed observations were recovered and whether their absence affected the calculation of the official AQI.
Why AQI figures differ
The gap between the CPCB’s AQI of 373 and the figure of 1,747 reported by some platforms has another explanation. Different organisations use different methods to calculate the index.
India’s National Air Quality Index, developed by the CPCB, has a maximum value of 500. The United States Environmental Protection Agency’s AQI methodology, used by several international platforms, does not have the same fixed ceiling. The two systems also use different pollutant thresholds and averaging periods.
India’s system relies on 24-hour averages for several pollutants, while the US methodology uses different periods, including one-hour and eight-hour averages for some pollutants. As a result, identical pollution concentrations can produce very different AQI scores.
The data sources may also vary. Some private platforms combine government monitoring data with readings from privately operated, low-cost sensors. Differences in calibration and data quality can further affect the results.
The CPCB maintains that its national AQI is the official measure for public information. Figures calculated using different methodologies, therefore, should not be treated as directly comparable.
However, differences in calculation methods cannot explain missing government observations or the revision of individual station readings. These issues require a separate explanation.
Sunil Dahiya, founder of Envirocatalyst, estimated that average PM2.5 concentrations remained between 450 and 550 µg/m³ through Diwali night. He warned that even a few hours of exposure at such levels could trigger or worsen health problems.
The central issue is not simply which AQI figure should be believed. It is whether Delhi’s monitoring system is providing a complete and reliable picture of the air people breathe.
The DPCC and CPCB must explain the missing readings, the changes made to published data and the impact these may have had on official pollution estimates. Transparent reporting is essential, particularly during severe pollution episodes, when people depend on accurate information to protect their health. An AQI figure is only as reliable as the measurements behind it.